Thread Load Distribution in Bolted Connections: Mechanical Fundamentals and FEA Insights
Executive Summary
In structural engineering, a common design assumption is that the total tensile load applied to a bolt is shared equally among all engaged threads of the nut or tapped hole. In reality, force distribution on the threads of a screw in bolted connections is heavily non-uniform. The first engaged thread carries a disproportionately high percentage of the total axial load—often exceeding 35% to 40%—while threads further along the engagement length carry progressively less load.
This article explores the mechanical reasons behind this non-uniform load distribution, presents a simplified analytical proof based on axial compliance and deformation compatibility, and demonstrates how 2D axisymmetric FEA models capture this critical phenomenon.
1. Why the First Engaged Threads Are More Stressed
To understand why the first engaged threads experience higher stress levels than subsequent ones, we can consider a simplified 1D structural model. Due to the high level of static indeterminacy in a threaded engagement, the axial forces spread into the mating components strictly according to their relative compliance.
Consider a simplified schematic where the individual threads are treated as infinitely stiff cantilever projections, leaving the cross-sectional area of the screw shank and the nut wall as the only deformable axial components:
- The screw shank is in tension, lengthening progressively from the first engaged thread toward the loaded head.
- The nut body is in compression, shortening as it transfers load toward its bearing face.
Because the screw expands in length while the nut contracts under load, the pitch of the screw increases while the pitch of the nut decreases. This differential deformation creates a severe pitch mismatch at the loaded face, forcing the first engaged thread to absorb the majority of the differential displacement.
2. Simplified Analytical Proof: Equilibrium and Congruence
We can demonstrate the physical necessity of this non-uniform distribution using basic equilibrium and congruence (compatibility) equations. Let S be the total tensile force acting on the fastener, and consider a two-thread engagement model where F1 and F2 represent the axial forces carried by the first and second threads, respectively.
Equilibrium Equation
Congruence (Compatibility) Equations
The axial elongation of the pitch step on the screw side (Δps) and the axial compression of the pitch step on the nut side (Δpns) depend on the force transmitted through the second thread F2, the material elastic moduli (Es, Ens), and their respective cross-sectional areas (As, Ans):
Δpns = − ( F2 · pns ) / ( Ens · Ans )
Equating the two displacement conditions yields:
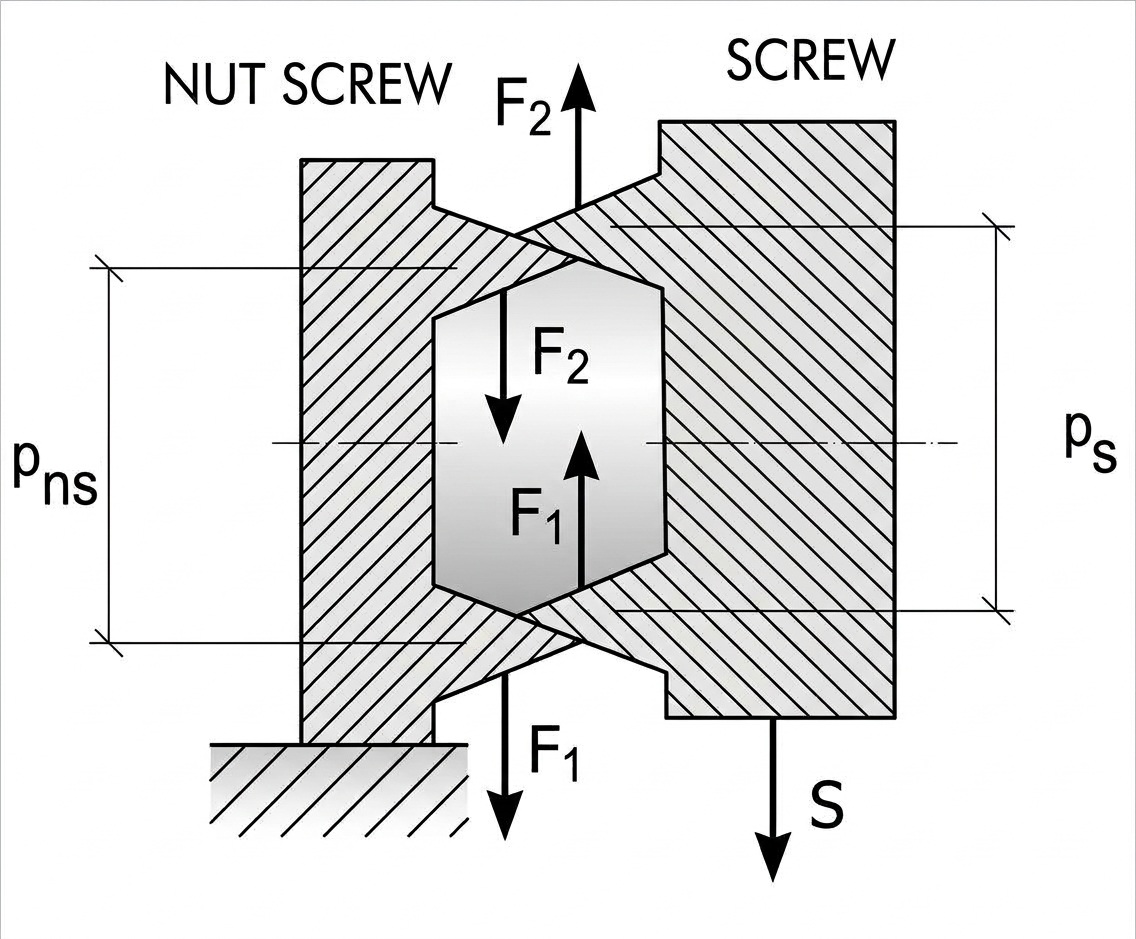
Physical Meaning: Since area, modulus, and thread pitch are strictly positive physical quantities, this equality can only be strictly satisfied if F2 = 0 under the assumed ideal rigid-thread hypothesis. In reality, thread bending, shear deformation, and local contact compliance allow F2 > 0, but this simple relationship proves why uniform loading across threads is physically impossible without local compliance or thread yield.
3. Practical Load Percentages Across Engaged Threads
Classical analytical studies as well as 3D non-linear FEA reveal a typical load distribution profile for standard ISO metric threads:
- 1st Engaged Thread: ~38% to 43% of the total axial load.
- 2nd Engaged Thread: ~18% to 22% of the total axial load.
- 3rd Engaged Thread: ~10% to 15% of the total axial load.
- 4th and subsequent threads: Progressively lower load share, with threads beyond the 6th or 7th carrying negligible additional force.
This non-uniform distribution explains why increasing the engaged height of a standard nut beyond 0.8 · d (approx. 6 to 7 threads) yields almost no increase in static tensile capacity or fatigue endurance.
4. FEA Example: 2D Axisymmetric Threaded Fastener Model
To accurately capture thread load distribution without incurring the computational expense of full 3D helical contact models, a 2D axisymmetric finite element model represents an excellent compromise for standard metric fasteners.
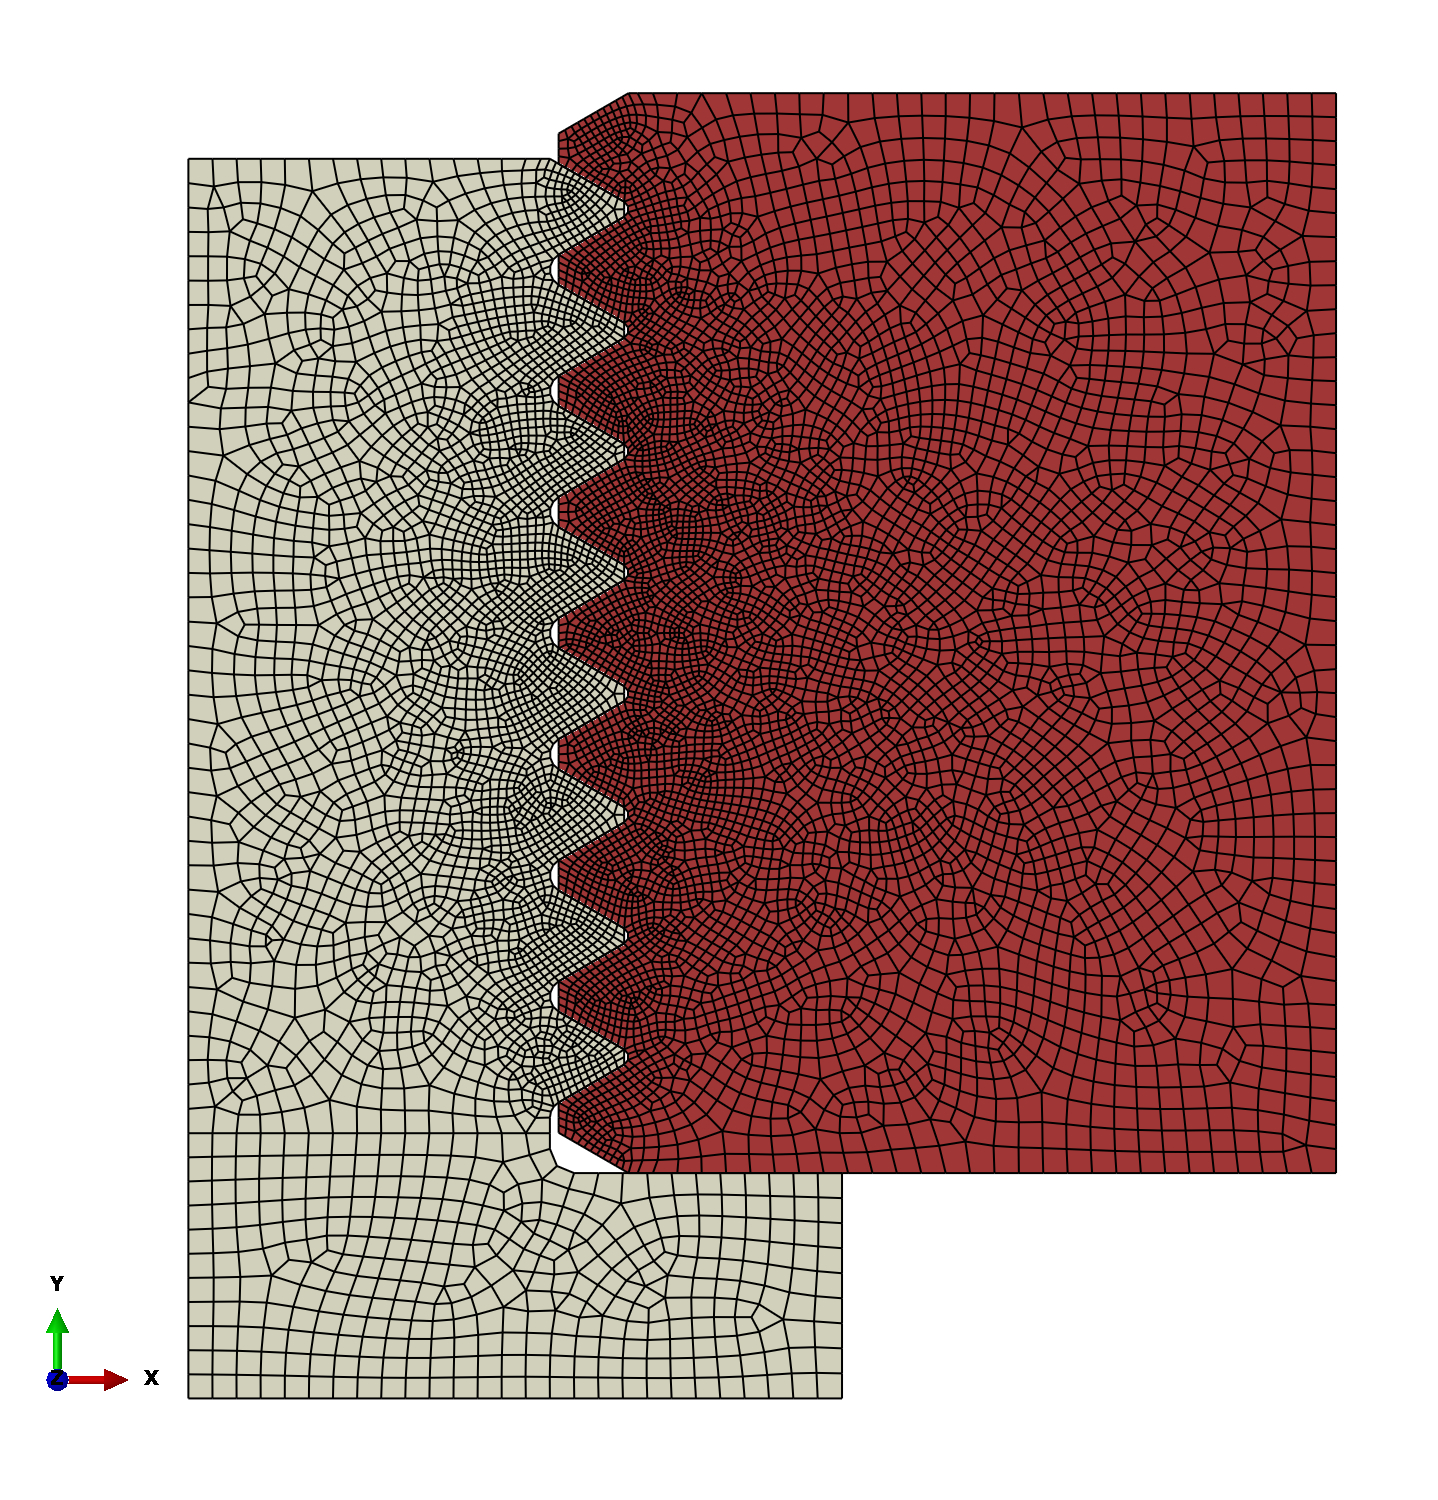
Below is a numerical study executed using an axisymmetric formulation with non-linear surface-to-surface contact defined along all mating thread flanks. The model simulates an M18 bolt engaged into a standard nut, subjected to nominal bolt pre-tensioning.
The material considered for the screw is a 8.8 Steel Class, meaning that Rt is 800 MPa and yield is at 0.8×800 = 640 MPa.
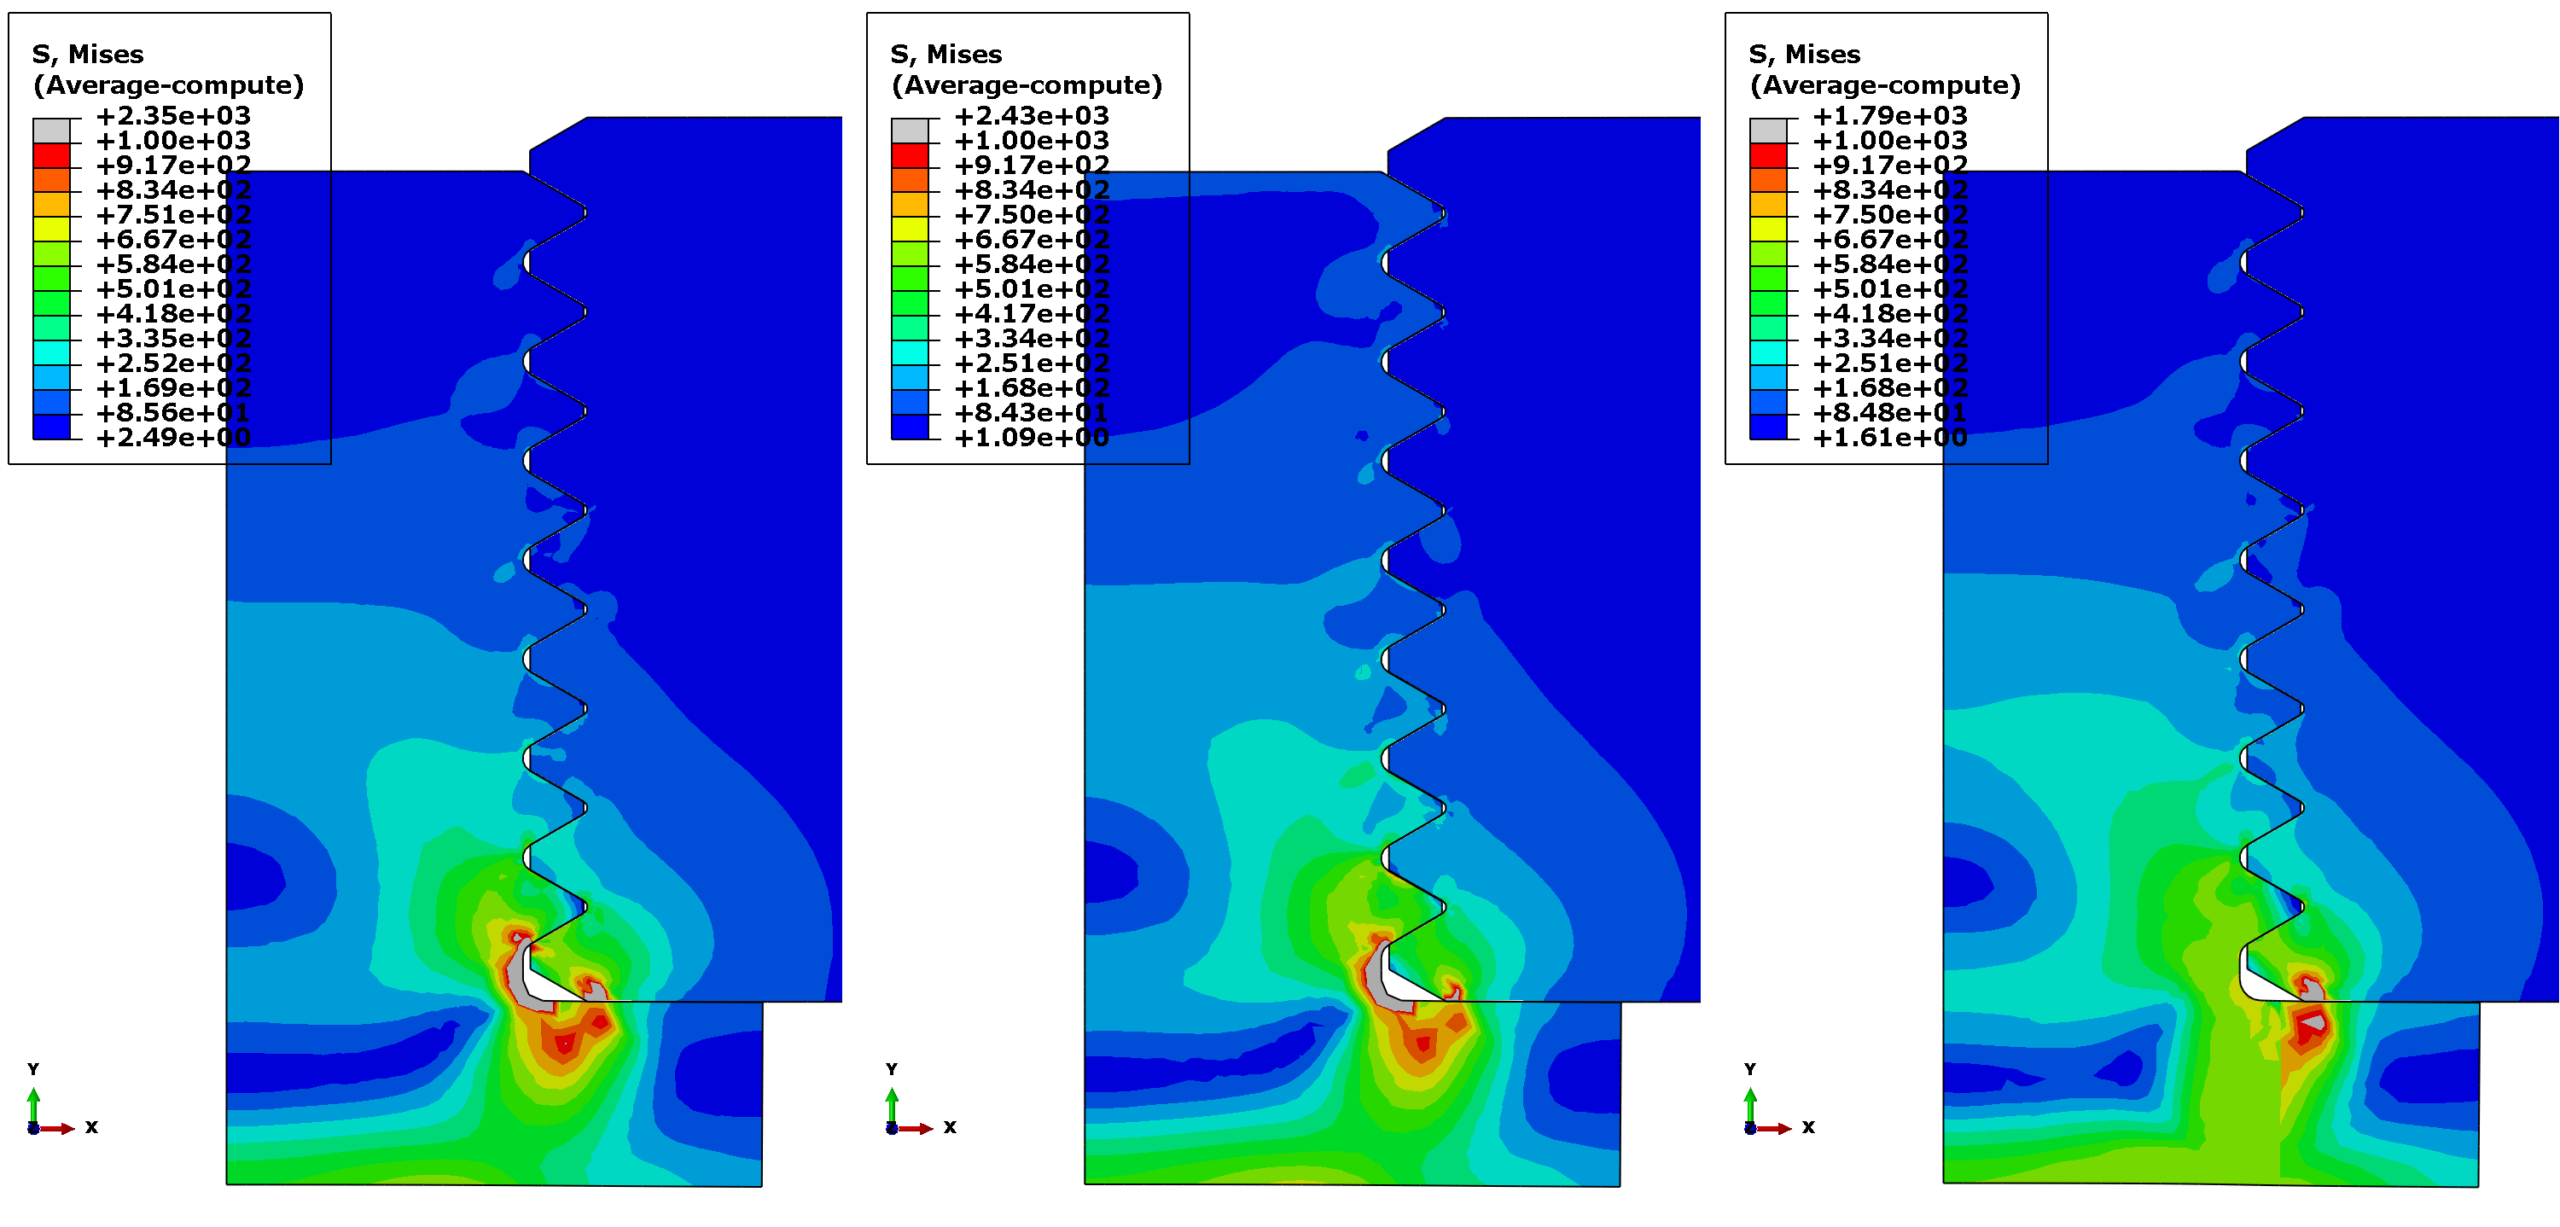
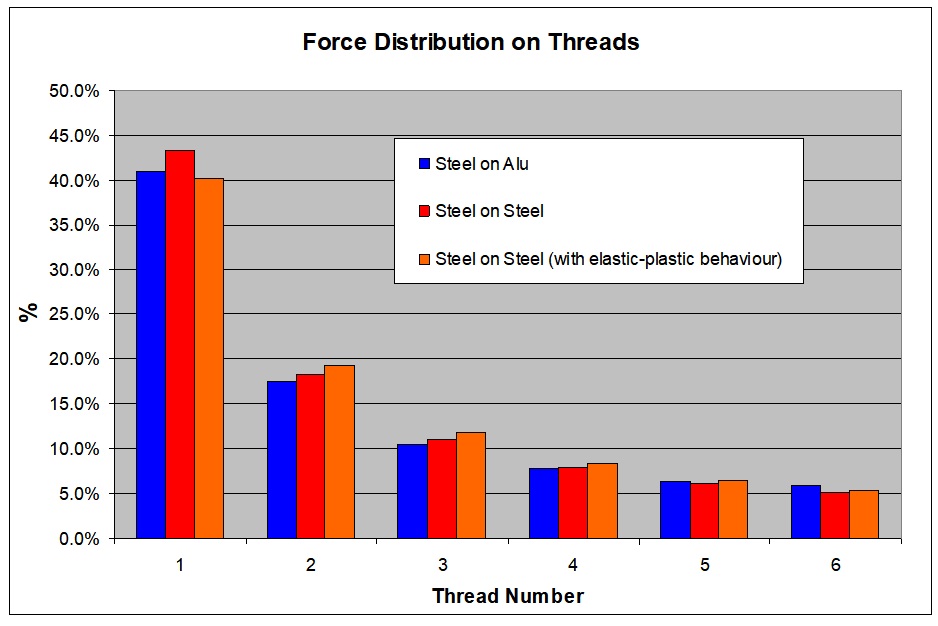
Three cases were then analysed:
4.1 Finite Element Mesh and Contact Setup
A refined Quad-dominant mesh is applied near the thread roots to properly resolve steep stress gradients and localized contact pressure distribution.
4.2 Von Mises Stress Distribution
The resulting Von Mises stress contour highlights the intense stress concentration localized at the root of the first engaged thread on the screw side, as well as the high bearing pressure at the contact flank of Thread 1 for all the three cases (even if the third, having a non linear material, has to be looked differently).
Moreover it has to be highlighted that the peak value is by far over the yield limit of the material of the screw, meaning that even for just the nominal preload a local plasticization takes place.
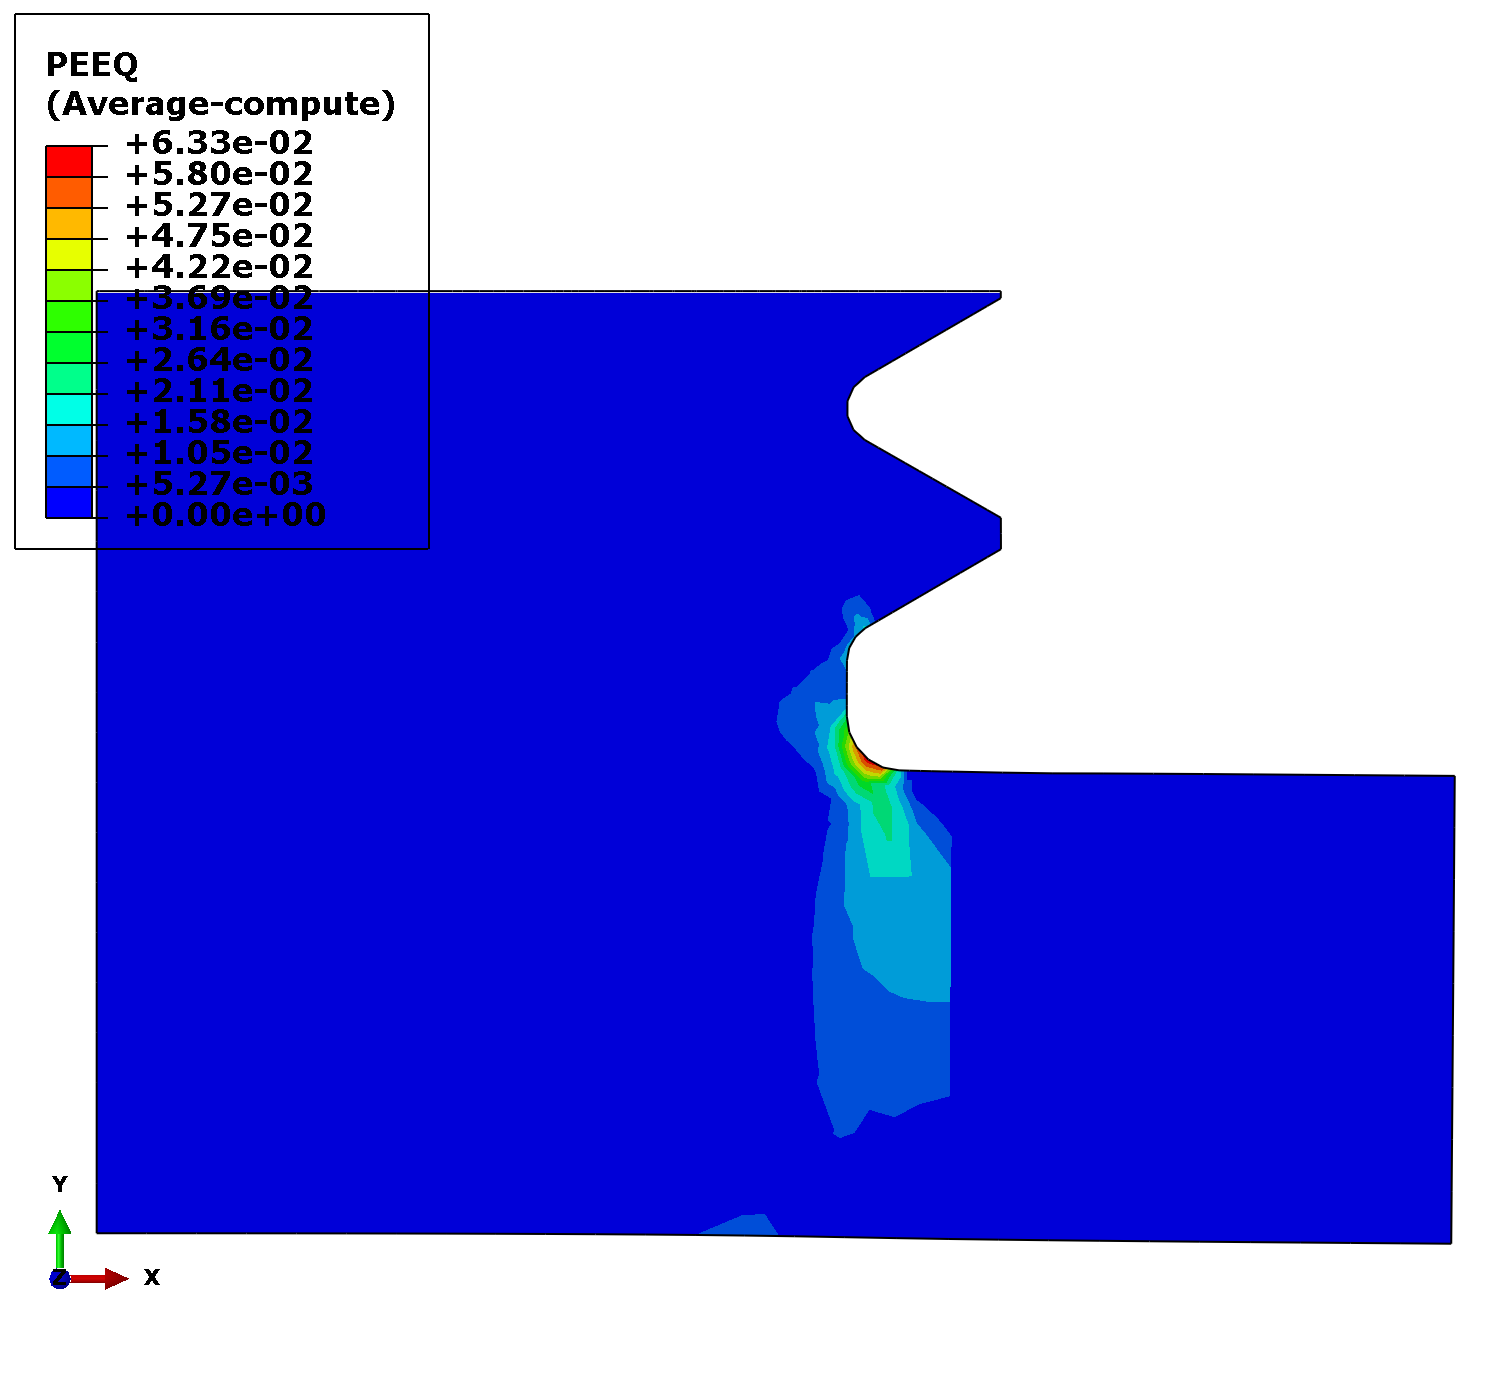
In fact, if we plot the Equivalent Plastic Strain for the third case (the only where the PEEQ value can exist) we have the situation in the figure below: a 6.3% of plastic strain exists even for a standard preload value.
4.3 Extracted Thread Force Distribution Curve
By integrating the normal contact forces across each individual thread flank, the non-linear FEA results confirm the classical analytical trend: the first thread absorbs the majority of the applied pre-load, while load sharing decays exponentially toward the top of the nut.
5. Conclusion
Understanding thread load distribution in bolted connections is essential for preventing fastener fatigue failure and thread stripping. Because the first engaged thread bears the heaviest load due to axial compliance mismatch, design strategies such as using undercut shanks, tension-nut designs, or materials with tailored compliance can help smooth out the load peak.
For a deeper insight of fastener mechanics, joint stiffness calculation and structural FE Modeling strategies, consult the book Computational Structural Engineering.
